
For my lesson I decided to adapt an earthquake lesson that I designed last Spring in the Explore Alaska course. I added a week long (or more) section where students will interview family members/elders/community members about an event (1964 quake, etc), and then present that information on a map of that area, including photographs and first hand accounts. Technology permitting, students can create their maps on computers using MapTEACH and/or Google Earth and add digital audio and photo links to areas of their maps. The unit can be introduced with a few TD clips (about the 1964 earthquake, or whatever event the class is focusing on).
Lesson Title: Alaskan Earthquakes
Abstract:
8th grade science – Earth Science, Earthquakes, one blocking period up to two weeks
Standards and GLE’s addressed in this lesson
State (Science Content - B, C, D):
State (Inquiry & Process, Technology, Culture, History and Nature of Science – A, E, F, G):
Materials Needed:
Large plastic and metal slinkies
Corn Starch
Water
Plastic Beakers – 250ml
Science notebooks
Colored pencils
Anchorage cross section handout
Maps of Anchorage and other AK Regions
Computers with Google Earth
MapTEACH software
GPS devises
Digital Audio Recorders and Cameras
New Vocabulary:
Seismic Waves, P waves,S waves,Surface Waves,Tsunamis, Epicenter, Liquefaction
Gear Up:
Materials: TD video - 1964 Alaska Earthquake
Timeline:10-15 minutes
Short Free write/Discussion on the 1964 Earthquake to elicit prior knowledge and then viewing the 1964 Alaska Earthquake video from TD. Then a quick post write on what they learned from the video.
Exploration:
Materials: Slinkies for every pair of students
Timeline:5 minutes – experimenting with slinkies to make different types of waves
Concept Introduction:
Materials:Slinkies, projector/smartBoard
Timeline:20-25 minutes – demo and practice of different seismic waves –observations in science notebooks. Comparison of quakes using the richter scale, historical records, and photos.
Concept Application:
Materials:Anchorage Cross Section Handout
Timeline:30-45 minutes – Students draw and label an imaginary earthquake occurring near Anchorage on the handout. Drawings should include the magnitude on the richter scale, all the seismic wave types, and damage to the city.
Concept Application:
Materials:
Maps of Anchorage and other Alaskan regions
Optional:
MapTEACH software
Google Earth
GPS
Digital audio recorders
Digital cameras
Computers
Timeline:1-2 weeks – Students interview family members, elders, teachers, etc. about 1964 earthquake, or another recent earthquake. If possible, students can check out GPS devices and mark locations of events before uploading them to the computer to create their maps (using the MapTEACH software or Google Earth). Students then create a map of the event on a poster or using the computer. Students should include pictures (drawn or photographs), interviews (transcribed or audio links), and other pertinent background information and research. Students then present information to the class (poster or computer presentation).
Additional Information for teachers: The last concept application could be applied to a variety of events, including tsunami, flooding, glaciers/ice floes melting, population declines, permafrost damage, etc. This could be used as part of a Climate Change unit to share stories from around Alaska and the rest of the world.
Sunday, April 11, 2010
Blog Reviews
Woven Ideas and Practices:
 This blog has a wonderful layout, with a nice wide format that shows off the colorful and well-chosen photos. I had a lot of trouble with the skinnier blog format that I chose, as well as the arrangement of my photos, and if I do another blog I would like it to be more like this one. I also like how each post is broken up into the explain/extend/evaluate categories. Misty does a great job of making her blog personal, informative, and concise. I enjoy the fact that she doesn’t spend a great deal of time re-wording information from the Explore Alaska blog, and instead builds on knowledge gained from there and adds in her own thoughts.
Dan's AK Connections:
 I chose Dan’s blog to review because of my ties to Southeast Alaska, as well as the interesting content and conversational nature. He always includes great photos and ties the information back to the education of his 5th grade students. I appreciate how he always includes some stories and information from Southeast, which helps to personalize the information and make it relevant. The student generated learning center for Earth Day is an excellent idea. This seems like a great way to make age appropriate information on global warming accessible to the other grade school students in the school.
Sunday, March 28, 2010
Module IX
Essential Question:
How are climate, terrestrial ice and Alaskan indigenous cultures all connected?
Living in Alaska one has many opportunities to explore the terrestrial ice portion of the cryosphere. Exit Glacier, a few miles outside of Seward, is a great spot to hike up to glacier, passing signs along the way that date the quick recession the glacier has experienced. You can hike along a trail up the side of the glacier to the Harding Ice Field, and if you enjoy sledding you can even bring along a garbage bag (light weight and easy to turn into a sled by making leg holes) and try out some of the little chutes on the way back down.

Many Alaskans depend on frozen lakes and rivers for transportation in the winter. My parents moved out to Flat Lake a few years ago, and drive over the Big Lake/Flat Lake ice road every day. They are some of the only permanent residents on the lake, and my father has a website on which he posts daily ice thickness and temperatures, as well as the latest accidents where brave individuals have driven through the channels and fallen through the ice!
 Big Lake ice road - Larry Taylor 2010

When I was preparing to go back to school to be a teacher I took a few great classes on glaciers from UAA that I highly recommend. One of them was a week long class where we camped along the Kenai Peninsula and learned all about the last ice age observed the signs left over from it. My favorite part of that class was hiking up a little hill near Homer and learning that out of all of Southern Alaska it was the only point that hadn't been covered by ice fields: A tiny green island in a sea of white ice. The other class was a series of Saturdays where we met up around Anchorage and the Mat-Su valley and observed glaciers and landforms left by the last ice age. One day we got to hike around on the Matanuska glacier, which involved crawling through an icy tunnel to see an under-ice river and observing supra glacial lakes and forests. It was breathtaking.
Living here I have always felt like the amount of water tied up in glaciers, ice fields, and permafrost was a tremendous amount, but when you look at the entire world's water budget you gain some perspective. Only 2.1% of water is found in glaciers, and 0.1% of the ice crystals in the world are in Alaska! Antarctica has a much larger percentage of those crystals (91.4%).

Areas of the Earth that have large ice shelves, such as Antarctica and Greenland, are important to the climate for many reasons. One of the major reasons is that the high albedo from the ice and new snow (it reflects 90% of the Sun's radiation) helps to keep Earth cool. Another reason is that when ice that is on land melts it raises sea level. If all of Antarctica melted it would raise sea level by a whopping 73 meters, which would make Atlantians out of millions if not billions of us. This lesson comparing sea ice to land ice showing the difference in sea level rise is a great one for students. Many of my students are from coastal regions of Alaska as well as the Phillipeans and Samoa, and understand how a small change in sea level can be catastrophic.
Antarctica is basically a frozen desert, and is the coldest, windiest, driest continent on earth with the highest average elevation. Because of the high albedo of ice and snow most of the solar radiation is reflected back into space, and due to it's latitude Antarctica doesn't get much solar radiation in the first place. In fact, at the moment I am writing this the temperature at the South Pole is an amazing -56 degrees Celsius!
It is important for Alaskan students to understand the Antarctic ecosystem because it is so similar to our recent (on the geologic time scale at least) past. We can learn a lot about the last ice age and what Alaska must have been like from studying the frozen continent. Also, by keeping track of the changes in ice depth, we can project the future rise in sea level. Students need to understand that this threat is very real, because most of the Earth's population lives near sea level. In Alaska and parts of Southeast Asia, as well as other locations across the globe, entire communities have already had to move upland to escape rising seas. Today's students will be the engineers and village elders of tomorrow that will make this eventuality possible.
How are climate, terrestrial ice and Alaskan indigenous cultures all connected?
Living in Alaska one has many opportunities to explore the terrestrial ice portion of the cryosphere. Exit Glacier, a few miles outside of Seward, is a great spot to hike up to glacier, passing signs along the way that date the quick recession the glacier has experienced. You can hike along a trail up the side of the glacier to the Harding Ice Field, and if you enjoy sledding you can even bring along a garbage bag (light weight and easy to turn into a sled by making leg holes) and try out some of the little chutes on the way back down.

Many Alaskans depend on frozen lakes and rivers for transportation in the winter. My parents moved out to Flat Lake a few years ago, and drive over the Big Lake/Flat Lake ice road every day. They are some of the only permanent residents on the lake, and my father has a website on which he posts daily ice thickness and temperatures, as well as the latest accidents where brave individuals have driven through the channels and fallen through the ice!
 Big Lake ice road - Larry Taylor 2010
Living here I have always felt like the amount of water tied up in glaciers, ice fields, and permafrost was a tremendous amount, but when you look at the entire world's water budget you gain some perspective. Only 2.1% of water is found in glaciers, and 0.1% of the ice crystals in the world are in Alaska! Antarctica has a much larger percentage of those crystals (91.4%).


Areas of the Earth that have large ice shelves, such as Antarctica and Greenland, are important to the climate for many reasons. One of the major reasons is that the high albedo from the ice and new snow (it reflects 90% of the Sun's radiation) helps to keep Earth cool. Another reason is that when ice that is on land melts it raises sea level. If all of Antarctica melted it would raise sea level by a whopping 73 meters, which would make Atlantians out of millions if not billions of us. This lesson comparing sea ice to land ice showing the difference in sea level rise is a great one for students. Many of my students are from coastal regions of Alaska as well as the Phillipeans and Samoa, and understand how a small change in sea level can be catastrophic.
Antarctica is basically a frozen desert, and is the coldest, windiest, driest continent on earth with the highest average elevation. Because of the high albedo of ice and snow most of the solar radiation is reflected back into space, and due to it's latitude Antarctica doesn't get much solar radiation in the first place. In fact, at the moment I am writing this the temperature at the South Pole is an amazing -56 degrees Celsius!
It is important for Alaskan students to understand the Antarctic ecosystem because it is so similar to our recent (on the geologic time scale at least) past. We can learn a lot about the last ice age and what Alaska must have been like from studying the frozen continent. Also, by keeping track of the changes in ice depth, we can project the future rise in sea level. Students need to understand that this threat is very real, because most of the Earth's population lives near sea level. In Alaska and parts of Southeast Asia, as well as other locations across the globe, entire communities have already had to move upland to escape rising seas. Today's students will be the engineers and village elders of tomorrow that will make this eventuality possible.
Sunday, March 21, 2010
Module VIII
Essential Question:
How are Arctic sea-ice, climate and culture all connected?
The Arctic influences the climate around the world in a variety of ways. Sea ice reflect solar radiation back into space due to its high albedo. As sea ice melts it creates a positive feedback look for global warming, because the more open water, the more solar radiation is absorbed to heat the planet. This teacher domain video is a nice illustration of this positive feedback loop. Sea ice also drives thermohaline circulation in the ocean, because as it freezes it excludes salt, and this salty cold water sinks due to its high density.

Climate effects are more dramatic in the Arctic because so much there is dependent on the sea ice. Subsistence hunters, fish, birds, and marine mammals all need the sea ice to survive, and it is melting very quickly, opening up routes for boats in the northwest passage where before it was solid ice. The ecosystem in the Arctic is very productive, because it has a large base of producers: ice algae and phytoplankton. However, due to the extremes of the climate there is very low biodiversity, and small changes in the population of one species, such as polar bears, can have a dramatic effect on the entire food web. Polar bears are threatened due to increased competition with other species (grizzlies, people, etc.) and loss of their sea ice habitat. The Arctic is also vulnerable because both wind and ocean currents bring pollution away from more industrialized areas, and that pollution works its way into and up the food chain, wreaking havoc in the upper levels through bioaccumulation.
 The Arctic Food Web
Recently scientists have begun to collect snow and ice data in the Arctic, and if we want older data we can look to the stories of indigenous Alaskans. These images found on the teachers domain website, show us the ice cover in the Arctic over the past 25 years. The national snow and ice data center gathers and displays field and satellite data about the cryosphere including the sea ice index and snow ground cover in the Arctic.
Due to the fact that climate change and endangered Arctic species are relatively recent, the value of local native knowledge on sea ice is very high. Not many other people have spent time learning what ecosystems in the Arctic are like, and we need to know what is normal there before we can see how it is changing and guess what it will be like in the future. The Arctic ecosystem is the first to show the ravages of climate change, and it can show us the dangers that will soon threaten the rest of the world. If we learn everything we can about what is happening there, hopefully we will have enough information to convince industrialized nations to reduce emissions and embrace alternative forms of electricity production.
How are Arctic sea-ice, climate and culture all connected?
The Arctic influences the climate around the world in a variety of ways. Sea ice reflect solar radiation back into space due to its high albedo. As sea ice melts it creates a positive feedback look for global warming, because the more open water, the more solar radiation is absorbed to heat the planet. This teacher domain video is a nice illustration of this positive feedback loop. Sea ice also drives thermohaline circulation in the ocean, because as it freezes it excludes salt, and this salty cold water sinks due to its high density.

Climate effects are more dramatic in the Arctic because so much there is dependent on the sea ice. Subsistence hunters, fish, birds, and marine mammals all need the sea ice to survive, and it is melting very quickly, opening up routes for boats in the northwest passage where before it was solid ice. The ecosystem in the Arctic is very productive, because it has a large base of producers: ice algae and phytoplankton. However, due to the extremes of the climate there is very low biodiversity, and small changes in the population of one species, such as polar bears, can have a dramatic effect on the entire food web. Polar bears are threatened due to increased competition with other species (grizzlies, people, etc.) and loss of their sea ice habitat. The Arctic is also vulnerable because both wind and ocean currents bring pollution away from more industrialized areas, and that pollution works its way into and up the food chain, wreaking havoc in the upper levels through bioaccumulation.
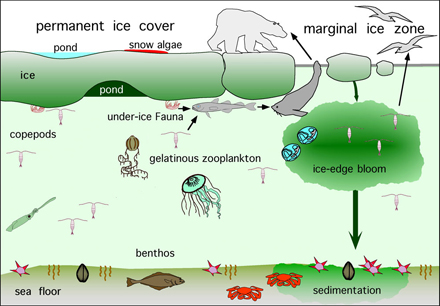 The Arctic Food Web
Recently scientists have begun to collect snow and ice data in the Arctic, and if we want older data we can look to the stories of indigenous Alaskans. These images found on the teachers domain website, show us the ice cover in the Arctic over the past 25 years. The national snow and ice data center gathers and displays field and satellite data about the cryosphere including the sea ice index and snow ground cover in the Arctic.

Due to the fact that climate change and endangered Arctic species are relatively recent, the value of local native knowledge on sea ice is very high. Not many other people have spent time learning what ecosystems in the Arctic are like, and we need to know what is normal there before we can see how it is changing and guess what it will be like in the future. The Arctic ecosystem is the first to show the ravages of climate change, and it can show us the dangers that will soon threaten the rest of the world. If we learn everything we can about what is happening there, hopefully we will have enough information to convince industrialized nations to reduce emissions and embrace alternative forms of electricity production.
Sunday, March 14, 2010
Module VII
Essential Question:
How is Earth's climate connected to its geological, biological and cultural systems?
I, along with my husband and another Romig teacher, have spent two weeks each summer for the last three summers in Eastern Washington participating in the Academy Creating Teacher Scientists (ACTS), funded by the Department of Energy (DOE). Together with 7 teachers from Washington we have focused on sustainability, materials, and biofuels. We toured many "green" buildings and designed ones of our own, toured wind farms, used fuel cells and designed possible vehicles that could use them, and met with many many scientists who taught us what is going on at the cutting edge of science. This past summer we toured through tree and switch grass farms and learned about their future viability as biofuels, and we made our own biofuel out of used donut oil. Through this experience I have learned a great deal about how climate change works, and the ways we may be able to mitigate its' effects in the future.

Our ACTS group at a switch grass farm- B. Walker summer '09
Carbon dioxide in our atmosphere causes global warming through a simple mechanism. It traps the sun’s radiation inside our atmosphere instead of letting it reflect back into space. An easy way to see this is to compare the planets Mercury and Venus. Venus has an atmosphere thick with greenhouse gasses (mostly CO2), whereas Mercury has a very thin atmosphere. Even though Venus is nearly twice as far from the Sun as Mercury, and receives only 25% of Mercury’s solar irradiance, Venus has a hotter surface (over 460 degrees Celsius compared to 420).

Carbon dioxide concentrations are increasing in our atmosphere due largely to the industrial revolution. Carbon that took millennia to be stored as coal, oil, and natural gas is being burned as fuel and released back into the atmosphere at an alarming rate. The Earth has natural ways to sequester carbon, including the aforementioned fossil fuels, calcium carbonate (formed on the ocean floor from skeletons and shells), and dissolving it in ocean water. All of these take a very long time, and they cannot keep up with the rate at which we are releasing the carbon. In the short term we can plant forests, as trees store large quantities of carbon in their trunks, but this is released when the trees are used for fuel or start to break down and rot.

A video on the teachers’ domain website called capturing carbon, tells the story of a scientist who is designing fake trees to take in carbon dioxide. The best part of the story is that he got the idea from his 12 year-old daughter’s science project. I think that students will find this video very empowering. Most of what we hear and teach on climate change deals with what humans are doing wrong, and it is great to learn about something positive that we are doing, especially someone their age came up with the idea!
Alaska is the canary in the coal mine of climate change. In the past few years we have seen channels open up in the previously iced in northwest passage, and on the north slope snow is later to arrive and earlier to leave. Flowers and berries have started to show up weeks before their normal arrival date, leaving migratory birds hungry right when they should be feeding their new chicks. We have had unprecedented insect outbreaks in our boreal forests, increased wild fires, reduced permafrost, receding glaciers, and dried up lakes, just to name a few of the changes. These changes have been documented both by indigenous and Western methods. There are many videos on the teachers domain website with native Alaskans sharing how their environment has changed, and data is being collected on permafrost depth, population density of different plant and animal species, and temperature changes.

A boat traveling through the previously iced in Northwest Passage
Having respected elders in to share their experiences with climate change, or watching videos of the same, can have a large impact on students, especially those of native Alaskan heritage. Students can also collect first hand research from family members on how Alaskan ecosystems have changed in their lifetimes. Students can also do research on the Internet to see how much temperatures have risen, and to discover other evidence of climate change. Something that is necessary for this to be useful is to teach students how to discover bias in website information and how to evaluate the information they find. I especially liked the two Information is beautiful websites that help bring all the climate change information into perspective – Climate Change Consensus, and Climate Change Contrast. The information found there will help both teachers and students wade through the conflicting and confusing data that both sides of the issue bring up.
In my class we spend a few months learning about Energy through the SEPUP Energy unit. Students learn the different methods of generating electricity and get to try out a few themselves including solar panels and a fuel cell model car  (purchased separate from the kit). They get very creative when asked to come up with ways to save energy in their homes and to design new methods of using renewable energy. I think it is important when learning about climate change to focus on the cause and effect as well as the mediation. One of the things that was so successful about Al Gore’s An Inconvenient Truth was that it included steps that every person can take to start to remedy the situation. Students need to feel empowered or they will give up and feel like they can’t do anything to make a difference so there is no use trying.
Sunday, March 7, 2010
Midway Point Blog Awards
Best Original Art - Woven Ideas and Practice
Best (and Spaciest) Background - Dave's Explore Alaska
Biggest "Bear" Bottom - Native Science
Best Personal Pictures on the Side - EUUC 58025 (Native Ways of Knowing)
Best, Most, and Most Persisent, Questions - Explore Alaska!
Best (and Spaciest) Background - Dave's Explore Alaska
Biggest "Bear" Bottom - Native Science
Best Personal Pictures on the Side - EUUC 58025 (Native Ways of Knowing)
Best, Most, and Most Persisent, Questions - Explore Alaska!
Module VI
Essential Question:
How are the Earth, atmosphere and cultures all connected?
One sunny clear day in Rhode Island, I watched two of my closest friends jump out of an airplane while we were flying 10,000 feet above the ground. And then I jumped out after them. We were on a skydiving trip with my school's outdoors club, and I had completed the only prerequisite needed for the jump; signing a piece of paper that said the company would not be held accountable if I failed to survive the experience. Needless to say, my parents were not pleased. Even though my father had the solid backing of his fellow commuting passengers (he had taken a poll and the response was overwhelmingly in his favor) I still jumped out of that plane with only the smallest reservations. Those came in full throttle as my body discovered it was falling through the air and accelerating at 9.80665 meters per second and my vital organs clamored to exit through my mouth. After a few terrifying seconds my falling body reached maximum velocity, and then the experience became quite pleasant. The ground was so far away that I felt like I was flying instead of falling, and by spreading my arms and shifting my weight I could traverse the sky. A great example of this fluid nature of the atmosphere can be seen in this National Geographic video on Youtube that includes a skydiver "surfing".
A few years ago I was able to experience this fluid nature of our atmosphere under much more comfortable conditions. During a family reunion in New Mexico, my sister, mother, and I rented a hot air balloon, and let the wind carry us along. The only thing we could control was our altitude, which we did to find the perfect wind speed to leisurely float over rooftops and down a river valley. Another balloon took off just after us, and it was amazing to watch the different paths we took through the sky, due to the slight differences in the wind direction and speed at our respective altitudes.
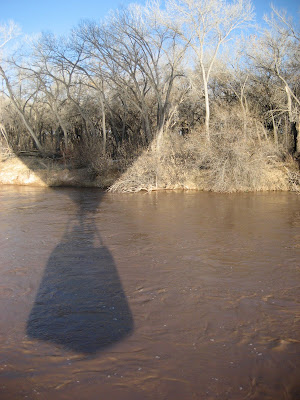
Dipping down into the river in our hot air balloon - C. Walker
Using Google Earth's weather layer I captured these images of the weather above both the North Atlantic and Pacific Oceans. Looking at them it is easy to see the fluid nature of our atmosphere. The prevalent wind patterns are also visible as they head up from the equator towards the Arctic.


The 8th grade science curriculum in Achorage doesn't get into the atmosphere and weather, and I never took any courses specifically on those subjects in college. The ExploreAlaska blog VI is a great resource for educators like me who know the basics but need a clear, informative collection of information and teaching tools to help students learn how the atmosphere works.
One TD resource from the blog enables one to see the vertical structure of the atmosphere and to learn how density and pressure decrease with altitude, while the air temperature is less consistent ad defines the four distinct atmospheric layers. A fun way to teach about the layers of the atmosphere in the science classroom would be to make the different layers out of different colors of jello, and have students insert appropriate objects (mountains, planes, clouds, space shuttles) into the appropriate layers. Another TD animation compares and contrasts warm and cold air fronts, and helped me to understand why it is so cold down on the ground during a warm air front. This could be demonstrated by mixing colored water of different temperatures.
I learned that convection in the atmosphere is very similar to that in liquids, and that the motion of rising and falling gasses due to their temperature, humidity, and density creates winds. The ocean plays a large role in this by heating the troposphere directly above it, and evaporation from the ocean adds to the humidity of the air. Winds are directed eastward by Earth's rotation and the uneven heating of Earth's surface. These winds are fastest at high altitudes due to the more extreme pressure differences found there and these large masses of moving air are called jet streams. The youtube video Global Circulation shows explains the poleward movement of wind from the equator due to atmospheric temperature and pressure.
All of this is very interesting and helps explain the weather we see around us, but the information in the blog that I found to be most intriguing was that on how global pollution rides the wind up from the equator to the polar regions. I had a faint prior understanding of this phenomenon, and I knew that there is a similar process going on with the ocean currents, but I had no idea of the extreme time scale on which it happens. Pollution from factories and power plants in Europe can make it up to the Arctic in a matter of days and within a few weeks it enters the food chain. Arctic organisms exposed to polluted air and water absorb the chemicals (heavy metals and persistent organic pollutants - POPs) and as plants and animals are successively eaten the toxins are accumulated in body fats and the effects increase as you go up the food chain, in a process known as bio- accumulation. This process is extremely dangerous for nursing mammals due to the fact that heavy metals and POPs accumulate in breast milk. This can lead to high infant mortality, low infant brith weight, and other health risks.
Information like this definitely fits into my 8th grade science curriculum, and makes a direct impact on the lives of my students and the animals around them. I already teach about bioaccumulation and its impacts on our ecosystem, but now I can teach my students how the chemicals arrive in our ecosystem in the first place, and where they come from. Tools like the Google Earth weather layer will make this very easy for them to see and understand. At the moment the process of pollutants from industrialized countries being deposited in the Arctic is being studied by the NASA ARCTAS mission and is not well known or understood, but as students start to become aware, society is bound to follow. I don't believe that societies will hold themselves accountable for their pollution that is rafted elsewhere by their own accord. It will have to be dealt with something akin to the current day international climate talks and agreements. In order for this to happen, we need to get the word out to as many people as possible, and as teachers we have a great platform from which to do so.
Friday, February 26, 2010
Module V
How are climate, cultures and oceans all connected?
I love living near the ocean, and have been able to do so for most of my life. I have lived in Sitka and Anchorage, AK, as well as Boston and Cape Cod, MA. The only years I spent away from the ocean were during my time in the Peace Corps, in the landlocked country of Mali, Northwest Africa. I missed the seafood, salty air, beaches, sea birds, and swimming. It is easy for me to see why more than 50% of the world's population lives near the ocean. We benefit from this proximity by obtaining food, salt, transportation, and a sense of well being.
Part of my love of the ocean is tied to my love of swimming. I have swum in the Pacific Ocean, Atlantic Ocean, Sea of Cortez, Gulf of Mexico, the Mediterranean, and the North Sea, as well as visiting the Bering Sea. Below are some maps from Google Earth with my swimming spots marked.

 The reason that many of these places were warm enough for me to swim in even though some are at high latitudes is that they are in the path of some of the warm ocean surface currents, driven by the Easterly winds at the equator, and the Westerlies at higher latitudes. The Gulf Stream runs up from the equator past Massachusetts and Maine, and then due to the shape of the Atlantic Ocean basin and the Westerlies it heads over to Europe to warm them up as well. In the Pacific Ocean the Japanese (Kuroshio) current warms the waters of Sitka, bringing pottery shards and glass buoys along with it .
These ocean surface currents are also driven by the deeper thermohaline currents known as the ocean conveyor belt. In the Arctic ocean the surface water brought by currents such as the Gulf Stream cools and then sinks and flows into the ocean basins with most of it upwelling in the Southern Oceans. This water is nutrient rich, and provides food for sea life in the equatorial region.
During my undergraduate studies I was able to study in Woods Hole, MA for a semester at the Marine Biological Laboratory with some of the worlds leading scientists. One of the most shocking things I learned there was that climate change may shut down or change the ocean conveyor belt. The reasoning behind this is that is there is a large influx of fresh water into the oceans (from sea ice, ice caps, and permafrost melting) the Arctic Ocean may not work as an engine for thermohaline circulation. The cold fresh water would not sink past the warmer more saline water below it. If this were the case a new conveyor belt might start up somewhere else, or perhaps not at all. This would mean much less food for sea life near the equator and much cooler temperatures in the North Pacific and Atlantic Oceans.
Students are interested in Oceans because their cultures have evolved beside and upon them. The oceans are a source of food for most people and many other species on the planet. Many of my students come from cultures that still need a healthy ocean to survive, such as Tlingit, Yupik, Phillipino, and Samoan. Other students might be interested in oceans due to foods and sea creatures that they are fond of.
As pollution and climate change threaten the living creatures within it we are going to start seeing some drastic food shortages around the world. Current oceanic events, such as coral reefs dying, unexplained declines in sea otter, sea lion, and shorebird populations, and a huge trash vortex in the Pacific Ocean are very personal to these students and help to interest them in learning about science. To further pique student interest teachers can invite speakers such as native elders into the classroom to share their culture's need for a healthy ocean, and their current experiences with pollution and climate change. There are also great videos of elders speaking found on the teachers domain website, such as "Living from the Land and Sea" and "Warmer Oceans Affect Food Web". Teachers can also take their students on field trips to places such as the Alaska Sealife Center in Seward that teach about what is going on with the ocean and how pollution can damage wildlife.
Taking students' interest in the oceans to a further level we can start to teach them about the relationship between regional climates and the warm ocean currents, and how climate change might shut all of these currents down. The youtube video demonstrating the high specific heat capacity of water is fun and very interesting, and would be an easy demo to do in the classroom. The teacher domain interactive site showing ocean currents is very clear and easy to understand and would also work very well in the classroom. Using technology such as Google Earth, Youtube Videos, and interactive websites we make this information fun and exciting for students in the classroom.
Sunday, February 21, 2010
Module IV
Essential Question: How do stories of cataclysmic events help inform students about geosciences and cultures?
My earliest memories of earthquakes involve watching the ensuing evacuation of downtown Sitka as people hurried to Sitka High, one of the highest refuges in town. Our house was situated on a high hill, and we could stay there and observe, safely above the land that the feared Tsunami would wash over. This was the early 1980's and the memory of the 1964 Quake must have still been fresh in everyone's minds. I always pictured that wave coming in as a giant wall of water, and only recently learned that it would have probably arrived as more of a monster high tide.
The 1964 earthquake was the last major earthquake that occurred in Southern Alaska. It was a 9.2 on the Richter Scale, making it the second largest quake in recorded history, and lasted for more than 4 minutes. It caused devastating damage in many Alaskan communities, including Anchorage, Valdez, and Seward. The quake was caused by plate tectonics, with the more dense Pacific Plate subducting beneath the North American Plate. Earthquakes are caused when pressure is released by the two plates sliding past each other. Southern Alaska has lots of little earthquakes caused by this process, and you can see the latest earthquakes by using the Real-time Earthquakes plugin found on Google Earth.

The Latest Earthquakes in Alaska, as seen on Google Earth, 2/21/10 - 1:59 pm
These little earthquakes actually help keep us safe. Seismologists start to worry when there is a respite from quakes anywhere along our tectonic plate boundary, because it means that pressure is building up, and the more pressure released in an earthquake, the bigger it is. In the case of the 1964 Quake, the released pressure allowed the N. American plate to rebound up about 9 meters underneath the ocean, and caused a large open ocean waves, or Tsunami. Underwater landslides in the bays of fjords also triggered local waves that did much to damage coastal communities.
Earthquakes originate at the point where pressure between the plates is released, which is called the epicenter. The first waves to leave the epicenter are the primary, or P waves. These look kind of "centipedy", moving like sound waves by compacting and extending. We can sense these waves, but they don't do much damage. The secondary, or S waves, that follow are much more damaging, as they move more sinuously, up and down and side to side. Together P and S waves cause surface waves, which make the ground undulate as if it were the ocean and tear buildings to pieces. Early warning systems are being designed that can be used in some areas, such as the San Andreas Fault, to detect the P waves and give up to 10-15 seconds of warning before the damage starts. This doesn't seem like much, but even a little time allows transportation systems to begin to slow and stop, greatly reducing the damage that could be caused.
This phenomenon is apparent along the northern boundary of the Pacific Plate, where it dives back down into the mantle, forming the Aleutian Trench, and subsequently the Aleutian Archipelago showing direct cause and effect. The Aleutian Archipelago consists of 300 mostly volcanic islands, and has at least 57 active volcanoes. These volcanoes can be explored through a great interactive site found on Teachers Domain.
Volcanoes can occur in the middle of tectonic plates as well, as shown by the Hawaiian Island Emporer Seamount Chain. This is believed to be caused by a "hot spot" underneath the Pacific plate, where superheated rock rises. As the Pacific Plate moves northward a few cm per year over this "hot spot" new volcanic islands are formed. In fact, a new volcanic island, Loihi, is building up beneath the ocean and is set to emerge in the next several thousand years.
It is important that today's students learn about cataclysmic events because society needs to continue to be plan for them happening, and be prepared when they do. This is easier to do in Southern Alaska, because we have evidence of the subduction zone all around us. However, not all students here grow up in coastal villages, hearing stories from elders about past tsunamis and quakes, or even watching the town evacuate after every earthquake as I did. It is easy to forget the past, even in Anchorage, where buildings disintegrated and half of 4th avenue dropped ten feet. Large houses and even high rises are being built atop the Bootlegger Cove clay west of C street. In the next large quake this clay will liquify and shake like jello, and some structures may even slide into Cook Inlet as they did in 1964. Schools no longer practice earthquake drills, which have been supplanted by the more exciting "stay put" and "lockdown" drills that deal with armed intruders.
As teachers we need to make sure that students receive the education about cataclysmic events that they might not be receiving from their families, tv shows, and favorite internet sites. Easy activities, such as squeezing toothpaste up through a slowly moving screen, can show students how the Pacific "hot spot" is creating the Hawaiian Islands. Technology such as Google Earth and Youtube can bring these events into the classroom and make them exciting and real for students. Google Earth can be used to show simple cause and effect with plate boundaries and the real time earthquakes plugin. Students can use the measuring tool to show that the Aleutian Archipelago mirrors the Aleutian trench, and then learn about specific volcanoes using the interactive Teachers Domain site mentioned above. They can complete an inquiry activity where they watch the amazing Youtube video of the 1958 Lituya Bay Tsunami (told by the fisherman and his son that rode the wave and survived) and use Google Earth to see what evidence of the Tsunami can be found, and to try to determine what caused the event.
The more our students know about cataclysmic events, the better our society will be able to predict and respond to cataclysmic events. Our culture lives in a subduction zone replete with earthquakes, tsunamis, and volcanic eruptions, and like cultures in the past we either need to adapt, migrate, or perish. I vote for adapting.
Earthquakes originate at the point where pressure between the plates is released, which is called the epicenter. The first waves to leave the epicenter are the primary, or P waves. These look kind of "centipedy", moving like sound waves by compacting and extending. We can sense these waves, but they don't do much damage. The secondary, or S waves, that follow are much more damaging, as they move more sinuously, up and down and side to side. Together P and S waves cause surface waves, which make the ground undulate as if it were the ocean and tear buildings to pieces. Early warning systems are being designed that can be used in some areas, such as the San Andreas Fault, to detect the P waves and give up to 10-15 seconds of warning before the damage starts. This doesn't seem like much, but even a little time allows transportation systems to begin to slow and stop, greatly reducing the damage that could be caused.
Plate boundaries are also the home to volcanoes, which are caused by the upwelling of superheated rock, or magma. As a subducting plate delves into the earth's crust it is reheated, and rises back up to the surface, creating a volcano.
 The Ring of Fire - where volcanoes and plate boundaries overlap
 The Ring of Fire - where volcanoes and plate boundaries overlap
Volcanoes can occur in the middle of tectonic plates as well, as shown by the Hawaiian Island Emporer Seamount Chain. This is believed to be caused by a "hot spot" underneath the Pacific plate, where superheated rock rises. As the Pacific Plate moves northward a few cm per year over this "hot spot" new volcanic islands are formed. In fact, a new volcanic island, Loihi, is building up beneath the ocean and is set to emerge in the next several thousand years.
It is important that today's students learn about cataclysmic events because society needs to continue to be plan for them happening, and be prepared when they do. This is easier to do in Southern Alaska, because we have evidence of the subduction zone all around us. However, not all students here grow up in coastal villages, hearing stories from elders about past tsunamis and quakes, or even watching the town evacuate after every earthquake as I did. It is easy to forget the past, even in Anchorage, where buildings disintegrated and half of 4th avenue dropped ten feet. Large houses and even high rises are being built atop the Bootlegger Cove clay west of C street. In the next large quake this clay will liquify and shake like jello, and some structures may even slide into Cook Inlet as they did in 1964. Schools no longer practice earthquake drills, which have been supplanted by the more exciting "stay put" and "lockdown" drills that deal with armed intruders.
As teachers we need to make sure that students receive the education about cataclysmic events that they might not be receiving from their families, tv shows, and favorite internet sites. Easy activities, such as squeezing toothpaste up through a slowly moving screen, can show students how the Pacific "hot spot" is creating the Hawaiian Islands. Technology such as Google Earth and Youtube can bring these events into the classroom and make them exciting and real for students. Google Earth can be used to show simple cause and effect with plate boundaries and the real time earthquakes plugin. Students can use the measuring tool to show that the Aleutian Archipelago mirrors the Aleutian trench, and then learn about specific volcanoes using the interactive Teachers Domain site mentioned above. They can complete an inquiry activity where they watch the amazing Youtube video of the 1958 Lituya Bay Tsunami (told by the fisherman and his son that rode the wave and survived) and use Google Earth to see what evidence of the Tsunami can be found, and to try to determine what caused the event.
The more our students know about cataclysmic events, the better our society will be able to predict and respond to cataclysmic events. Our culture lives in a subduction zone replete with earthquakes, tsunamis, and volcanic eruptions, and like cultures in the past we either need to adapt, migrate, or perish. I vote for adapting.
Sunday, February 14, 2010
Module III
Essential Question: How are landscapes formed and how, in turn, are cultures shaped by their landscapes?

I was born in Sitka, Alaska. Sitka is positioned on the Western side of Baranof Island, in Southeast Alaska and is bordered by mountains to the East, and Sitka Sound to the West, sheltered from the brunt of the Pacific Ocean by Kruzof Island.
 A typical day at the beach when I was little, photo taken by my mother
The landscape in Southeastern Alaska has been formed mostly through tectonic plate movement. Most of Alaska lies on the North American plate, and as the more dense Pacific plate subducts beneath it mountains are pushed up from the ocean floor, forming Southeast and South-central Alaska. As the Pacific plate begins to melt back into the mantle it creates rising magma and volcanoes, which build up new landforms. One such volcano visible from Sitka, Mt. Edgecumbe, erupted long ago, covering the area in up to twenty feet of ash, contributing to the fertile soil in the region. More recently this 3,200 foot volcano was the subject of an April Fool's day joke, when resident Porky Bickar helicoptered more than 70 old tires into the crater and lit them on fire, causing quite a ruckus in town.
 Swimming this summer at John Brown's beach with a view of Mt. Edgecumbe,
photo taken by my husband Ben
Southeastern Alaska has also been shaped by erosion caused by glaciers, the ocean, rivers, wind, and rain. In the last ice age this area was covered in ice, and U- shaped valleys formed while mountains were carved and rounded. The area was depressed by the weight of the glaciers and is currently rebounding, and in some places sea level is actually retreating.
Sitka is one of the oldest and most culturally rich communities in Alaska. The word Sitka comes from the contraction of the Tlingit name "Shee-Atika" which means people on the side of the Shee (Baranof Island). Some trace the Tlingit in Sitka back 10,000 years. The Russians discovered Sitka in 1741 and the last major stand by the Tligits against the Russians occurred in 1804. Then known as "New Archangel", it became the Russian capitol in 1808. The location was so highly valued by both the Russians and Tlingits because of the abundant furs, salmon, lumber, and ice (from man-made Swan Lake near the center of town). Both cultures found it easy to live off the land as well as enriching to trade and barter the goods that could be easily acquired there. Because the land was so easy to live off of, and so accessible by the sea, the Tlingit culture had to fend off many other Alaskan native peoples long before the arrival of the Russians, and this experience helped them to hold them off for as long as they did.
 A Tlingit totem in Totem Park, photo by Cat Walker
 The Russian Orthodox church in the center of town, photo by Cat Walker
To this day the landscape remains hospitable to wildlife as well as the ~8,000 human inhabitants. When I was a child my sister and I would wade out into the rivers and scoop up the returning salmon with our bare hands. Sea life is still plentiful and currently Sitka is the 6th largest port by value of seafood harvest in the U.S. and has the largest harbor system in Alaska. The Japanese current runs up past Sitka, making the waters warm enough for swimming, and the volcanic ash fertilizer along with the abundant rain fall (86" per year) helps the forest grow large and green.
Living close to the land, as the Tlingit people did and to some extent still do, enables people to stay healthy as individuals and as a culture. Unless the land has been polluted, as it has been in some areas of the Arctic region by global weather patterns and bio-accumulation, the food that hunters and gatherers collect is extremely healthy. The sense of pride in providing for oneself and one's family, readily apparent in this video about the Cu'pik people of Chevak, provides a mental health that is hard to achieve in a Western Culture, where we see little connection between the work that we do and the food and shelter that sustain us.
Google Earth helps change the way I look at the world in a variety of ways. In this case, it helped me to remember the landscape I spent the first 10 years of my life surrounded by, as well as helping me to discover things about it I never would have learned due to the limits of hiking and boating. In other instances it has helped me to research areas that I have never been able to visit, and due to monetary constrictions will probably not make it to.
I have shared Google Earth with my students as an introductory lesson where we drop pins for each student in the place they consider home, and then throughout the year we revisit these places and share cultural and geologic information. I also have been able to teach an elective that focuses on GIS/GPS and we spend time learning how to construct maps of the landscape around them and derive information from maps found online. One of the lessons I plan on having the class complete is to introduce their "home" through a map they construct that has both visual and audio links to their family history. I hope this will engage students by helping them learn more about Alaskan cultures and the land around them. Perhaps some of these students who grow up with a foot in each culture will someday have careers similar to Richard Glenn where they can return to their villages and share their expertise to the benefit of their people and the world around them.

I was born in Sitka, Alaska. Sitka is positioned on the Western side of Baranof Island, in Southeast Alaska and is bordered by mountains to the East, and Sitka Sound to the West, sheltered from the brunt of the Pacific Ocean by Kruzof Island.
 A typical day at the beach when I was little, photo taken by my mother
 Swimming this summer at John Brown's beach with a view of Mt. Edgecumbe,
photo taken by my husband Ben
Southeastern Alaska has also been shaped by erosion caused by glaciers, the ocean, rivers, wind, and rain. In the last ice age this area was covered in ice, and U- shaped valleys formed while mountains were carved and rounded. The area was depressed by the weight of the glaciers and is currently rebounding, and in some places sea level is actually retreating.
Sitka is one of the oldest and most culturally rich communities in Alaska. The word Sitka comes from the contraction of the Tlingit name "Shee-Atika" which means people on the side of the Shee (Baranof Island). Some trace the Tlingit in Sitka back 10,000 years. The Russians discovered Sitka in 1741 and the last major stand by the Tligits against the Russians occurred in 1804. Then known as "New Archangel", it became the Russian capitol in 1808. The location was so highly valued by both the Russians and Tlingits because of the abundant furs, salmon, lumber, and ice (from man-made Swan Lake near the center of town). Both cultures found it easy to live off the land as well as enriching to trade and barter the goods that could be easily acquired there. Because the land was so easy to live off of, and so accessible by the sea, the Tlingit culture had to fend off many other Alaskan native peoples long before the arrival of the Russians, and this experience helped them to hold them off for as long as they did.
 A Tlingit totem in Totem Park, photo by Cat Walker
 The Russian Orthodox church in the center of town, photo by Cat Walker
Living close to the land, as the Tlingit people did and to some extent still do, enables people to stay healthy as individuals and as a culture. Unless the land has been polluted, as it has been in some areas of the Arctic region by global weather patterns and bio-accumulation, the food that hunters and gatherers collect is extremely healthy. The sense of pride in providing for oneself and one's family, readily apparent in this video about the Cu'pik people of Chevak, provides a mental health that is hard to achieve in a Western Culture, where we see little connection between the work that we do and the food and shelter that sustain us.
Google Earth helps change the way I look at the world in a variety of ways. In this case, it helped me to remember the landscape I spent the first 10 years of my life surrounded by, as well as helping me to discover things about it I never would have learned due to the limits of hiking and boating. In other instances it has helped me to research areas that I have never been able to visit, and due to monetary constrictions will probably not make it to.
I have shared Google Earth with my students as an introductory lesson where we drop pins for each student in the place they consider home, and then throughout the year we revisit these places and share cultural and geologic information. I also have been able to teach an elective that focuses on GIS/GPS and we spend time learning how to construct maps of the landscape around them and derive information from maps found online. One of the lessons I plan on having the class complete is to introduce their "home" through a map they construct that has both visual and audio links to their family history. I hope this will engage students by helping them learn more about Alaskan cultures and the land around them. Perhaps some of these students who grow up with a foot in each culture will someday have careers similar to Richard Glenn where they can return to their villages and share their expertise to the benefit of their people and the world around them.
Saturday, February 6, 2010
Module II
Essential Question: How is everything connected from the perspectives of indigenous peoples and Western scientists? What are the advantages to knowing both ways?
Below is a Venn Diagram adapted from Sidney Stephens' Handbook for Culturally Responsive science curriculum. Click on the picture to enlarge.
 I didn't realize how informative this Venn Diagram is about the similarities and differences of Indigenous and Scientific knowledge until I had read through Module II and taken notes on all of the readings and videos. So much of what I jotted down can be found in this diagram in a much more succinct format.
I spent much of my childhood in Sitka, Alaska outdoors. Later on I spent a few years in the Peace Corps living in a remote Malian village living off the land. Due to these experiences the Indigenous way of knowing makes a great deal of sense to me. Native peoples view the world in a holistic way, and through their close relationship with the environment they see the complex system of interconnectedness of every aspect around them. Everything has a spirit, and the goal is to coexist within their surroundings, doing their best as part of a circle of life. Knowledge is qualitative and is passed down through oral histories and traditions in an unstructured way. Traits such as character, patience, stress tolerance, and creativity are valued in these cultures because they enable individuals to survive and gain knowledge and teach it to their people.
I also was brought up in schools teaching the structured reductionist ways of Western Science. I learned the value of using quantitative knowledge dependent on institutions and processes to explain the world around us. Western Science also believes that the everything is connected (through unified string theory), and is able to use amazing technological breakthroughs and global perspective to further understand just how interconnected the universe truly is. By studying the relationships between the atmosphere, lithosphere, hydrosphere, and biosphere we can see how those component parts have evolved, function, and will further evolve. The same traits of individuals are valued in Western science that I mentioned above (character, patience, stress tolerance, and creativity) because they enable scientists like Galileo, Newton, and Einstein to modify our knowledge base.
Advantages of both ways of knowing are easily demonstrated through the work of Dustin Madden, an assistant science teacher in the Anchorage School District. A teacher domain video of Madden teaching shows how he is incorporating hands on, holistic, inquiry based methods into his science classroom. Indigenous peoples have had a much longer time to build up their knowledge base, whereas Western science is able to incorporate technology and communication to gather knowledge on a more global, or even universal, scale. These two knowledge bases compliment each other because both can bring something to the table that the other does not have.
If we apply both ways of knowing to education we make knowledge more interesting and accessible to students. Scientific learning should be integrated with other subjects to teach students a more global perspective, and students should learn in a more holistic way so they can see the impact of their lives on the world around them. If we learn from a traditional native education we can see that students are more involved when the learning is student centered and begins with local knowledge that builds to learning about the world and universe. Students also benefit from hands on inquiry based methods such as getting them out into nature to explore, seen in the Dustin Madden video. Resources that we can use to integrate both perspectives are numerous. If we have access to Native elders they can be invited into the classroom to share knowledge, or we can take the students to them to experience the traditional way of life. If this is too difficult, we can show videos showing the Native lifestyle and perspective to our students. Many of these can be found at the Teachers Domain website, and Polar-Palooza website.
There is great value in both ways of knowing. We are able to gain from the rich knowledge base of indigenous people at the same time as we use cutting edge technology to see how the world around us works and changes. We can't truly understand how interconnected everything around us is until we take both ways of knowing into account. We are part of the circle of life, but we shouldn't be limited to coexisting with nature. We want our students to also be able to figure out how things work, why they work, and how they will change.
Subscribe to:
Comments (Atom)

