
For my lesson I decided to adapt an earthquake lesson that I designed last Spring in the Explore Alaska course. I added a week long (or more) section where students will interview family members/elders/community members about an event (1964 quake, etc), and then present that information on a map of that area, including photographs and first hand accounts. Technology permitting, students can create their maps on computers using MapTEACH and/or Google Earth and add digital audio and photo links to areas of their maps. The unit can be introduced with a few TD clips (about the 1964 earthquake, or whatever event the class is focusing on).
Lesson Title: Alaskan Earthquakes
Abstract:
8th grade science – Earth Science, Earthquakes, one blocking period up to two weeks
Standards and GLE’s addressed in this lesson
State (Science Content - B, C, D):
State (Inquiry & Process, Technology, Culture, History and Nature of Science – A, E, F, G):
Materials Needed:
Large plastic and metal slinkies
Corn Starch
Water
Plastic Beakers – 250ml
Science notebooks
Colored pencils
Anchorage cross section handout
Maps of Anchorage and other AK Regions
Computers with Google Earth
MapTEACH software
GPS devises
Digital Audio Recorders and Cameras
New Vocabulary:
Seismic Waves, P waves,S waves,Surface Waves,Tsunamis, Epicenter, Liquefaction
Gear Up:
Materials: TD video - 1964 Alaska Earthquake
Timeline:10-15 minutes
Short Free write/Discussion on the 1964 Earthquake to elicit prior knowledge and then viewing the 1964 Alaska Earthquake video from TD. Then a quick post write on what they learned from the video.
Exploration:
Materials: Slinkies for every pair of students
Timeline:5 minutes – experimenting with slinkies to make different types of waves
Concept Introduction:
Materials:Slinkies, projector/smartBoard
Timeline:20-25 minutes – demo and practice of different seismic waves –observations in science notebooks. Comparison of quakes using the richter scale, historical records, and photos.
Concept Application:
Materials:Anchorage Cross Section Handout
Timeline:30-45 minutes – Students draw and label an imaginary earthquake occurring near Anchorage on the handout. Drawings should include the magnitude on the richter scale, all the seismic wave types, and damage to the city.
Concept Application:
Materials:
Maps of Anchorage and other Alaskan regions
Optional:
MapTEACH software
Google Earth
GPS
Digital audio recorders
Digital cameras
Computers
Timeline:1-2 weeks – Students interview family members, elders, teachers, etc. about 1964 earthquake, or another recent earthquake. If possible, students can check out GPS devices and mark locations of events before uploading them to the computer to create their maps (using the MapTEACH software or Google Earth). Students then create a map of the event on a poster or using the computer. Students should include pictures (drawn or photographs), interviews (transcribed or audio links), and other pertinent background information and research. Students then present information to the class (poster or computer presentation).
Additional Information for teachers: The last concept application could be applied to a variety of events, including tsunami, flooding, glaciers/ice floes melting, population declines, permafrost damage, etc. This could be used as part of a Climate Change unit to share stories from around Alaska and the rest of the world.
Sunday, April 11, 2010
Blog Reviews
Woven Ideas and Practices:
 This blog has a wonderful layout, with a nice wide format that shows off the colorful and well-chosen photos. I had a lot of trouble with the skinnier blog format that I chose, as well as the arrangement of my photos, and if I do another blog I would like it to be more like this one. I also like how each post is broken up into the explain/extend/evaluate categories. Misty does a great job of making her blog personal, informative, and concise. I enjoy the fact that she doesn’t spend a great deal of time re-wording information from the Explore Alaska blog, and instead builds on knowledge gained from there and adds in her own thoughts.
Dan's AK Connections:
 I chose Dan’s blog to review because of my ties to Southeast Alaska, as well as the interesting content and conversational nature. He always includes great photos and ties the information back to the education of his 5th grade students. I appreciate how he always includes some stories and information from Southeast, which helps to personalize the information and make it relevant. The student generated learning center for Earth Day is an excellent idea. This seems like a great way to make age appropriate information on global warming accessible to the other grade school students in the school.
Sunday, March 28, 2010
Module IX
Essential Question:
How are climate, terrestrial ice and Alaskan indigenous cultures all connected?
Living in Alaska one has many opportunities to explore the terrestrial ice portion of the cryosphere. Exit Glacier, a few miles outside of Seward, is a great spot to hike up to glacier, passing signs along the way that date the quick recession the glacier has experienced. You can hike along a trail up the side of the glacier to the Harding Ice Field, and if you enjoy sledding you can even bring along a garbage bag (light weight and easy to turn into a sled by making leg holes) and try out some of the little chutes on the way back down.

Many Alaskans depend on frozen lakes and rivers for transportation in the winter. My parents moved out to Flat Lake a few years ago, and drive over the Big Lake/Flat Lake ice road every day. They are some of the only permanent residents on the lake, and my father has a website on which he posts daily ice thickness and temperatures, as well as the latest accidents where brave individuals have driven through the channels and fallen through the ice!
 Big Lake ice road - Larry Taylor 2010

When I was preparing to go back to school to be a teacher I took a few great classes on glaciers from UAA that I highly recommend. One of them was a week long class where we camped along the Kenai Peninsula and learned all about the last ice age observed the signs left over from it. My favorite part of that class was hiking up a little hill near Homer and learning that out of all of Southern Alaska it was the only point that hadn't been covered by ice fields: A tiny green island in a sea of white ice. The other class was a series of Saturdays where we met up around Anchorage and the Mat-Su valley and observed glaciers and landforms left by the last ice age. One day we got to hike around on the Matanuska glacier, which involved crawling through an icy tunnel to see an under-ice river and observing supra glacial lakes and forests. It was breathtaking.
Living here I have always felt like the amount of water tied up in glaciers, ice fields, and permafrost was a tremendous amount, but when you look at the entire world's water budget you gain some perspective. Only 2.1% of water is found in glaciers, and 0.1% of the ice crystals in the world are in Alaska! Antarctica has a much larger percentage of those crystals (91.4%).

Areas of the Earth that have large ice shelves, such as Antarctica and Greenland, are important to the climate for many reasons. One of the major reasons is that the high albedo from the ice and new snow (it reflects 90% of the Sun's radiation) helps to keep Earth cool. Another reason is that when ice that is on land melts it raises sea level. If all of Antarctica melted it would raise sea level by a whopping 73 meters, which would make Atlantians out of millions if not billions of us. This lesson comparing sea ice to land ice showing the difference in sea level rise is a great one for students. Many of my students are from coastal regions of Alaska as well as the Phillipeans and Samoa, and understand how a small change in sea level can be catastrophic.
Antarctica is basically a frozen desert, and is the coldest, windiest, driest continent on earth with the highest average elevation. Because of the high albedo of ice and snow most of the solar radiation is reflected back into space, and due to it's latitude Antarctica doesn't get much solar radiation in the first place. In fact, at the moment I am writing this the temperature at the South Pole is an amazing -56 degrees Celsius!
It is important for Alaskan students to understand the Antarctic ecosystem because it is so similar to our recent (on the geologic time scale at least) past. We can learn a lot about the last ice age and what Alaska must have been like from studying the frozen continent. Also, by keeping track of the changes in ice depth, we can project the future rise in sea level. Students need to understand that this threat is very real, because most of the Earth's population lives near sea level. In Alaska and parts of Southeast Asia, as well as other locations across the globe, entire communities have already had to move upland to escape rising seas. Today's students will be the engineers and village elders of tomorrow that will make this eventuality possible.
How are climate, terrestrial ice and Alaskan indigenous cultures all connected?
Living in Alaska one has many opportunities to explore the terrestrial ice portion of the cryosphere. Exit Glacier, a few miles outside of Seward, is a great spot to hike up to glacier, passing signs along the way that date the quick recession the glacier has experienced. You can hike along a trail up the side of the glacier to the Harding Ice Field, and if you enjoy sledding you can even bring along a garbage bag (light weight and easy to turn into a sled by making leg holes) and try out some of the little chutes on the way back down.

Many Alaskans depend on frozen lakes and rivers for transportation in the winter. My parents moved out to Flat Lake a few years ago, and drive over the Big Lake/Flat Lake ice road every day. They are some of the only permanent residents on the lake, and my father has a website on which he posts daily ice thickness and temperatures, as well as the latest accidents where brave individuals have driven through the channels and fallen through the ice!
 Big Lake ice road - Larry Taylor 2010
Living here I have always felt like the amount of water tied up in glaciers, ice fields, and permafrost was a tremendous amount, but when you look at the entire world's water budget you gain some perspective. Only 2.1% of water is found in glaciers, and 0.1% of the ice crystals in the world are in Alaska! Antarctica has a much larger percentage of those crystals (91.4%).


Areas of the Earth that have large ice shelves, such as Antarctica and Greenland, are important to the climate for many reasons. One of the major reasons is that the high albedo from the ice and new snow (it reflects 90% of the Sun's radiation) helps to keep Earth cool. Another reason is that when ice that is on land melts it raises sea level. If all of Antarctica melted it would raise sea level by a whopping 73 meters, which would make Atlantians out of millions if not billions of us. This lesson comparing sea ice to land ice showing the difference in sea level rise is a great one for students. Many of my students are from coastal regions of Alaska as well as the Phillipeans and Samoa, and understand how a small change in sea level can be catastrophic.
Antarctica is basically a frozen desert, and is the coldest, windiest, driest continent on earth with the highest average elevation. Because of the high albedo of ice and snow most of the solar radiation is reflected back into space, and due to it's latitude Antarctica doesn't get much solar radiation in the first place. In fact, at the moment I am writing this the temperature at the South Pole is an amazing -56 degrees Celsius!
It is important for Alaskan students to understand the Antarctic ecosystem because it is so similar to our recent (on the geologic time scale at least) past. We can learn a lot about the last ice age and what Alaska must have been like from studying the frozen continent. Also, by keeping track of the changes in ice depth, we can project the future rise in sea level. Students need to understand that this threat is very real, because most of the Earth's population lives near sea level. In Alaska and parts of Southeast Asia, as well as other locations across the globe, entire communities have already had to move upland to escape rising seas. Today's students will be the engineers and village elders of tomorrow that will make this eventuality possible.
Sunday, March 21, 2010
Module VIII
Essential Question:
How are Arctic sea-ice, climate and culture all connected?
The Arctic influences the climate around the world in a variety of ways. Sea ice reflect solar radiation back into space due to its high albedo. As sea ice melts it creates a positive feedback look for global warming, because the more open water, the more solar radiation is absorbed to heat the planet. This teacher domain video is a nice illustration of this positive feedback loop. Sea ice also drives thermohaline circulation in the ocean, because as it freezes it excludes salt, and this salty cold water sinks due to its high density.

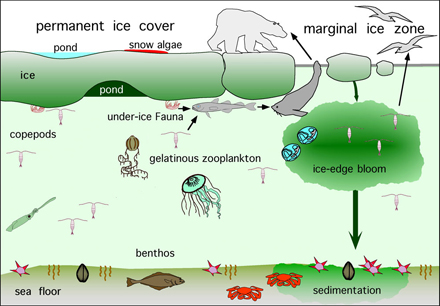
Climate effects are more dramatic in the Arctic because so much there is dependent on the sea ice. Subsistence hunters, fish, birds, and marine mammals all need the sea ice to survive, and it is melting very quickly, opening up routes for boats in the northwest passage where before it was solid ice. The ecosystem in the Arctic is very productive, because it has a large base of producers: ice algae and phytoplankton. However, due to the extremes of the climate there is very low biodiversity, and small changes in the population of one species, such as polar bears, can have a dramatic effect on the entire food web. Polar bears are threatened due to increased competition with other species (grizzlies, people, etc.) and loss of their sea ice habitat. The Arctic is also vulnerable because both wind and ocean currents bring pollution away from more industrialized areas, and that pollution works its way into and up the food chain, wreaking havoc in the upper levels through bioaccumulation.
 The Arctic Food Web
Recently scientists have begun to collect snow and ice data in the Arctic, and if we want older data we can look to the stories of indigenous Alaskans. These images found on the teachers domain website, show us the ice cover in the Arctic over the past 25 years. The national snow and ice data center gathers and displays field and satellite data about the cryosphere including the sea ice index and snow ground cover in the Arctic.
Due to the fact that climate change and endangered Arctic species are relatively recent, the value of local native knowledge on sea ice is very high. Not many other people have spent time learning what ecosystems in the Arctic are like, and we need to know what is normal there before we can see how it is changing and guess what it will be like in the future. The Arctic ecosystem is the first to show the ravages of climate change, and it can show us the dangers that will soon threaten the rest of the world. If we learn everything we can about what is happening there, hopefully we will have enough information to convince industrialized nations to reduce emissions and embrace alternative forms of electricity production.
How are Arctic sea-ice, climate and culture all connected?
The Arctic influences the climate around the world in a variety of ways. Sea ice reflect solar radiation back into space due to its high albedo. As sea ice melts it creates a positive feedback look for global warming, because the more open water, the more solar radiation is absorbed to heat the planet. This teacher domain video is a nice illustration of this positive feedback loop. Sea ice also drives thermohaline circulation in the ocean, because as it freezes it excludes salt, and this salty cold water sinks due to its high density.

Climate effects are more dramatic in the Arctic because so much there is dependent on the sea ice. Subsistence hunters, fish, birds, and marine mammals all need the sea ice to survive, and it is melting very quickly, opening up routes for boats in the northwest passage where before it was solid ice. The ecosystem in the Arctic is very productive, because it has a large base of producers: ice algae and phytoplankton. However, due to the extremes of the climate there is very low biodiversity, and small changes in the population of one species, such as polar bears, can have a dramatic effect on the entire food web. Polar bears are threatened due to increased competition with other species (grizzlies, people, etc.) and loss of their sea ice habitat. The Arctic is also vulnerable because both wind and ocean currents bring pollution away from more industrialized areas, and that pollution works its way into and up the food chain, wreaking havoc in the upper levels through bioaccumulation.
 The Arctic Food Web
Recently scientists have begun to collect snow and ice data in the Arctic, and if we want older data we can look to the stories of indigenous Alaskans. These images found on the teachers domain website, show us the ice cover in the Arctic over the past 25 years. The national snow and ice data center gathers and displays field and satellite data about the cryosphere including the sea ice index and snow ground cover in the Arctic.

Due to the fact that climate change and endangered Arctic species are relatively recent, the value of local native knowledge on sea ice is very high. Not many other people have spent time learning what ecosystems in the Arctic are like, and we need to know what is normal there before we can see how it is changing and guess what it will be like in the future. The Arctic ecosystem is the first to show the ravages of climate change, and it can show us the dangers that will soon threaten the rest of the world. If we learn everything we can about what is happening there, hopefully we will have enough information to convince industrialized nations to reduce emissions and embrace alternative forms of electricity production.
Sunday, March 14, 2010
Module VII
Essential Question:
How is Earth's climate connected to its geological, biological and cultural systems?
I, along with my husband and another Romig teacher, have spent two weeks each summer for the last three summers in Eastern Washington participating in the Academy Creating Teacher Scientists (ACTS), funded by the Department of Energy (DOE). Together with 7 teachers from Washington we have focused on sustainability, materials, and biofuels. We toured many "green" buildings and designed ones of our own, toured wind farms, used fuel cells and designed possible vehicles that could use them, and met with many many scientists who taught us what is going on at the cutting edge of science. This past summer we toured through tree and switch grass farms and learned about their future viability as biofuels, and we made our own biofuel out of used donut oil. Through this experience I have learned a great deal about how climate change works, and the ways we may be able to mitigate its' effects in the future.

Our ACTS group at a switch grass farm- B. Walker summer '09
Carbon dioxide in our atmosphere causes global warming through a simple mechanism. It traps the sun’s radiation inside our atmosphere instead of letting it reflect back into space. An easy way to see this is to compare the planets Mercury and Venus. Venus has an atmosphere thick with greenhouse gasses (mostly CO2), whereas Mercury has a very thin atmosphere. Even though Venus is nearly twice as far from the Sun as Mercury, and receives only 25% of Mercury’s solar irradiance, Venus has a hotter surface (over 460 degrees Celsius compared to 420).

Carbon dioxide concentrations are increasing in our atmosphere due largely to the industrial revolution. Carbon that took millennia to be stored as coal, oil, and natural gas is being burned as fuel and released back into the atmosphere at an alarming rate. The Earth has natural ways to sequester carbon, including the aforementioned fossil fuels, calcium carbonate (formed on the ocean floor from skeletons and shells), and dissolving it in ocean water. All of these take a very long time, and they cannot keep up with the rate at which we are releasing the carbon. In the short term we can plant forests, as trees store large quantities of carbon in their trunks, but this is released when the trees are used for fuel or start to break down and rot.

A video on the teachers’ domain website called capturing carbon, tells the story of a scientist who is designing fake trees to take in carbon dioxide. The best part of the story is that he got the idea from his 12 year-old daughter’s science project. I think that students will find this video very empowering. Most of what we hear and teach on climate change deals with what humans are doing wrong, and it is great to learn about something positive that we are doing, especially someone their age came up with the idea!
Alaska is the canary in the coal mine of climate change. In the past few years we have seen channels open up in the previously iced in northwest passage, and on the north slope snow is later to arrive and earlier to leave. Flowers and berries have started to show up weeks before their normal arrival date, leaving migratory birds hungry right when they should be feeding their new chicks. We have had unprecedented insect outbreaks in our boreal forests, increased wild fires, reduced permafrost, receding glaciers, and dried up lakes, just to name a few of the changes. These changes have been documented both by indigenous and Western methods. There are many videos on the teachers domain website with native Alaskans sharing how their environment has changed, and data is being collected on permafrost depth, population density of different plant and animal species, and temperature changes.

A boat traveling through the previously iced in Northwest Passage
Having respected elders in to share their experiences with climate change, or watching videos of the same, can have a large impact on students, especially those of native Alaskan heritage. Students can also collect first hand research from family members on how Alaskan ecosystems have changed in their lifetimes. Students can also do research on the Internet to see how much temperatures have risen, and to discover other evidence of climate change. Something that is necessary for this to be useful is to teach students how to discover bias in website information and how to evaluate the information they find. I especially liked the two Information is beautiful websites that help bring all the climate change information into perspective – Climate Change Consensus, and Climate Change Contrast. The information found there will help both teachers and students wade through the conflicting and confusing data that both sides of the issue bring up.
In my class we spend a few months learning about Energy through the SEPUP Energy unit. Students learn the different methods of generating electricity and get to try out a few themselves including solar panels and a fuel cell model car  (purchased separate from the kit). They get very creative when asked to come up with ways to save energy in their homes and to design new methods of using renewable energy. I think it is important when learning about climate change to focus on the cause and effect as well as the mediation. One of the things that was so successful about Al Gore’s An Inconvenient Truth was that it included steps that every person can take to start to remedy the situation. Students need to feel empowered or they will give up and feel like they can’t do anything to make a difference so there is no use trying.
Sunday, March 7, 2010
Midway Point Blog Awards
Best Original Art - Woven Ideas and Practice
Best (and Spaciest) Background - Dave's Explore Alaska
Biggest "Bear" Bottom - Native Science
Best Personal Pictures on the Side - EUUC 58025 (Native Ways of Knowing)
Best, Most, and Most Persisent, Questions - Explore Alaska!
Best (and Spaciest) Background - Dave's Explore Alaska
Biggest "Bear" Bottom - Native Science
Best Personal Pictures on the Side - EUUC 58025 (Native Ways of Knowing)
Best, Most, and Most Persisent, Questions - Explore Alaska!
Module VI
Essential Question:
How are the Earth, atmosphere and cultures all connected?
One sunny clear day in Rhode Island, I watched two of my closest friends jump out of an airplane while we were flying 10,000 feet above the ground. And then I jumped out after them. We were on a skydiving trip with my school's outdoors club, and I had completed the only prerequisite needed for the jump; signing a piece of paper that said the company would not be held accountable if I failed to survive the experience. Needless to say, my parents were not pleased. Even though my father had the solid backing of his fellow commuting passengers (he had taken a poll and the response was overwhelmingly in his favor) I still jumped out of that plane with only the smallest reservations. Those came in full throttle as my body discovered it was falling through the air and accelerating at 9.80665 meters per second and my vital organs clamored to exit through my mouth. After a few terrifying seconds my falling body reached maximum velocity, and then the experience became quite pleasant. The ground was so far away that I felt like I was flying instead of falling, and by spreading my arms and shifting my weight I could traverse the sky. A great example of this fluid nature of the atmosphere can be seen in this National Geographic video on Youtube that includes a skydiver "surfing".
A few years ago I was able to experience this fluid nature of our atmosphere under much more comfortable conditions. During a family reunion in New Mexico, my sister, mother, and I rented a hot air balloon, and let the wind carry us along. The only thing we could control was our altitude, which we did to find the perfect wind speed to leisurely float over rooftops and down a river valley. Another balloon took off just after us, and it was amazing to watch the different paths we took through the sky, due to the slight differences in the wind direction and speed at our respective altitudes.
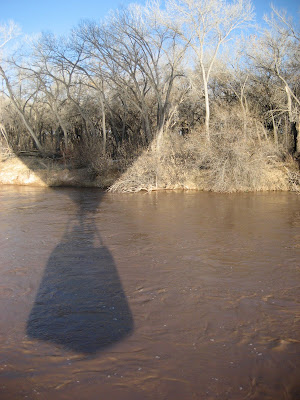
Dipping down into the river in our hot air balloon - C. Walker
Using Google Earth's weather layer I captured these images of the weather above both the North Atlantic and Pacific Oceans. Looking at them it is easy to see the fluid nature of our atmosphere. The prevalent wind patterns are also visible as they head up from the equator towards the Arctic.


The 8th grade science curriculum in Achorage doesn't get into the atmosphere and weather, and I never took any courses specifically on those subjects in college. The ExploreAlaska blog VI is a great resource for educators like me who know the basics but need a clear, informative collection of information and teaching tools to help students learn how the atmosphere works.
One TD resource from the blog enables one to see the vertical structure of the atmosphere and to learn how density and pressure decrease with altitude, while the air temperature is less consistent ad defines the four distinct atmospheric layers. A fun way to teach about the layers of the atmosphere in the science classroom would be to make the different layers out of different colors of jello, and have students insert appropriate objects (mountains, planes, clouds, space shuttles) into the appropriate layers. Another TD animation compares and contrasts warm and cold air fronts, and helped me to understand why it is so cold down on the ground during a warm air front. This could be demonstrated by mixing colored water of different temperatures.
I learned that convection in the atmosphere is very similar to that in liquids, and that the motion of rising and falling gasses due to their temperature, humidity, and density creates winds. The ocean plays a large role in this by heating the troposphere directly above it, and evaporation from the ocean adds to the humidity of the air. Winds are directed eastward by Earth's rotation and the uneven heating of Earth's surface. These winds are fastest at high altitudes due to the more extreme pressure differences found there and these large masses of moving air are called jet streams. The youtube video Global Circulation shows explains the poleward movement of wind from the equator due to atmospheric temperature and pressure.
All of this is very interesting and helps explain the weather we see around us, but the information in the blog that I found to be most intriguing was that on how global pollution rides the wind up from the equator to the polar regions. I had a faint prior understanding of this phenomenon, and I knew that there is a similar process going on with the ocean currents, but I had no idea of the extreme time scale on which it happens. Pollution from factories and power plants in Europe can make it up to the Arctic in a matter of days and within a few weeks it enters the food chain. Arctic organisms exposed to polluted air and water absorb the chemicals (heavy metals and persistent organic pollutants - POPs) and as plants and animals are successively eaten the toxins are accumulated in body fats and the effects increase as you go up the food chain, in a process known as bio- accumulation. This process is extremely dangerous for nursing mammals due to the fact that heavy metals and POPs accumulate in breast milk. This can lead to high infant mortality, low infant brith weight, and other health risks.
Information like this definitely fits into my 8th grade science curriculum, and makes a direct impact on the lives of my students and the animals around them. I already teach about bioaccumulation and its impacts on our ecosystem, but now I can teach my students how the chemicals arrive in our ecosystem in the first place, and where they come from. Tools like the Google Earth weather layer will make this very easy for them to see and understand. At the moment the process of pollutants from industrialized countries being deposited in the Arctic is being studied by the NASA ARCTAS mission and is not well known or understood, but as students start to become aware, society is bound to follow. I don't believe that societies will hold themselves accountable for their pollution that is rafted elsewhere by their own accord. It will have to be dealt with something akin to the current day international climate talks and agreements. In order for this to happen, we need to get the word out to as many people as possible, and as teachers we have a great platform from which to do so.
Subscribe to:
Comments (Atom)

